


Richland County, North Dakota
About
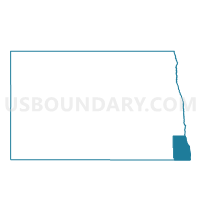
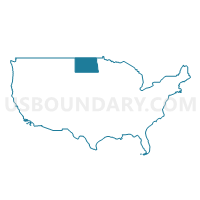
Outline

Summary
| Unique Area Identifier | 119839 |
| Name | Richland County |
| State | North Dakota |
| Area (square miles) | 1,445.45 |
| Land Area (square miles) | 1,435.78 |
| Water Area (square miles) | 9.67 |
| % of Land Area | 99.33 |
| % of Water Area | 0.67 |
| Latitude of the Internal Point | 46.26521920 |
| Longtitude of the Internal Point | -96.93795990 |
| Total Population | 16,321 |
| Total Housing Units | 7,503 |
| Total Households | 6,651 |
| Median Age | 39.4 |
Maps
Graphs
Select a template below for downloading or customizing gragh for Richland County, North Dakota


Neighbors
Neighoring County (by Name) Neighboring County on the Map
- Cass County, ND
- Clay County, MN
- Marshall County, SD
- Ransom County, ND
- Roberts County, SD
- Sargent County, ND
- Traverse County, MN
- Wilkin County, MN
County Subdivision in Richland County (by Name) Neighboring County Subdivision on the Map
- Abercrombie city, Richland County, ND
- Abercrombie township, Richland County, ND
- Antelope township, Richland County, ND
- Barney city, Richland County, ND
- Barney township, Richland County, ND
- Barrie township, Richland County, ND
- Belford township, Richland County, ND
- Brandenburg township, Richland County, ND
- Brightwood township, Richland County, ND
- Center township, Richland County, ND
- Christine city, Richland County, ND
- Colfax city, Richland County, ND
- Colfax township, Richland County, ND
- Danton township, Richland County, ND
- Devillo township, Richland County, ND
- Dexter township, Richland County, ND
- Duerr township, Richland County, ND
- Dwight city, Richland County, ND
- Dwight township, Richland County, ND
- Eagle township, Richland County, ND
- Elma township, Richland County, ND
- Fairmount city, Richland County, ND
- Fairmount township, Richland County, ND
- Freeman township, Richland County, ND
- Garborg township, Richland County, ND
- Grant township, Richland County, ND
- Great Bend city, Richland County, ND
- Greendale township, Richland County, ND
- Hankinson city, Richland County, ND
- Helendale township, Richland County, ND
- Homestead township, Richland County, ND
- Ibsen township, Richland County, ND
- LaMars township, Richland County, ND
- Liberty Grove township, Richland County, ND
- Lidgerwood city, Richland County, ND
- Mantador city, Richland County, ND
- Mooreton city, Richland County, ND
- Mooreton township, Richland County, ND
- Moran township, Richland County, ND
- Nansen township, Richland County, ND
- Sheyenne township, Richland County, ND
- Summit township, Richland County, ND
- Viking township, Richland County, ND
- Wahpeton city, Richland County, ND
- Walcott city, Richland County, ND
- Walcott township, Richland County, ND
- Waldo township, Richland County, ND
- West End township, Richland County, ND
- Wyndmere city, Richland County, ND
- Wyndmere township, Richland County, ND
Top 10 Neighboring Place (by Population) Neighboring Place on the Map
- Wahpeton city, ND (7,766)
- Breckenridge city, MN (3,386)
- Hankinson city, ND (919)
- Lidgerwood city, ND (652)
- Wyndmere city, ND (429)
- Fairmount city, ND (367)
- Abercrombie city, ND (263)
- Walcott city, ND (235)
- Mooreton city, ND (197)
- Christine city, ND (150)
Top 10 Neighboring Unified School District (by Population) Neighboring Unified School District on the Map
- Wahpeton Public School District 37, ND (9,424)
- Sisseton School District 54-2, SD (7,853)
- Breckenridge Public School District, MN (5,035)
- Barnesville Public School District, MN (4,455)
- Kindred Public School District 2, ND (3,559)
- Lisbon Public School District 19, ND (3,391)
- Wheaton Area School Public School District, MN (2,186)
- Enderlin Area Public School District 24, ND (2,046)
- Hankinson Public School District 8, ND (1,721)
- Richland Public School District 44, ND (1,398)
Top 10 Neighboring State Legislative District Lower Chamber (by Population) Neighboring State Legislative District Lower Chamber on the Map
- State House District 9B, MN (39,347)
- State House District 22, ND (20,531)
- State House District 1, SD (20,515)
- State House District 25, ND (13,025)
- State House District 26, ND (12,887)
Top 10 Neighboring State Legislative District Upper Chamber (by Population) Neighboring State Legislative District Upper Chamber on the Map
- State Senate District 9, MN (81,765)
- State Senate District 22, ND (20,531)
- State Senate District 1, SD (20,515)
- State Senate District 25, ND (13,025)
- State Senate District 26, ND (12,887)
Top 10 Neighboring 111th Congressional District (by Population) Neighboring 111th Congressional District on the Map
- Congressional District (at Large), SD (814,180)
- Congressional District (at Large), ND (672,591)
- Congressional District 7, MN (625,512)
Top 10 Census Tract in Richland County (by Population) Neighboring Census Tract on the Map
- Census Tract 9709, Richland County, ND (4,027)
- Census Tract 9710, Richland County, ND (3,814)
- Census Tract 9714, Richland County, ND (2,879)
- Census Tract 9708, Richland County, ND (2,163)
- Census Tract 9707, Richland County, ND (2,111)
- Census Tract 9711, Richland County, ND (1,327)
Top 10 Neighboring 5-Digit ZIP Code Tabulation Area (by Population) Neighboring 5-Digit ZIP Code Tabulation Area on the Map
- 56560, MN (40,766)
- 58075, ND (9,276)
- 56520, MN (3,983)
- 58047, ND (3,560)
- 56296, MN (2,029)
- 58041, ND (1,545)
- 58051, ND (1,458)
- 58060, ND (1,329)
- 58053, ND (1,171)
- 57260, SD (1,093)
Data
Demographic, Population, Households, and Housing Units
** Data sources from census 2010 **
Show Data on Map
Download Full List as CSV
Download Quick Sheet as CSV
| Subject | This Area | North Dakota | National |
|---|---|---|---|
| POPULATION | |||
| Total Population Map | 16,321 | 672,591 | 308,745,538 |
| POPULATION, HISPANIC OR LATINO ORIGIN | |||
| Not Hispanic or Latino Map | 16,050 | 659,124 | 258,267,944 |
| Hispanic or Latino Map | 271 | 13,467 | 50,477,594 |
| POPULATION, RACE | |||
| White alone Map | 15,507 | 605,449 | 223,553,265 |
| Black or African American alone Map | 110 | 7,960 | 38,929,319 |
| American Indian and Alaska Native alone Map | 330 | 36,591 | 2,932,248 |
| Asian alone Map | 88 | 6,909 | 14,674,252 |
| Native Hawaiian and Other Pacific Islander alone Map | 9 | 320 | 540,013 |
| Some Other Race alone Map | 67 | 3,509 | 19,107,368 |
| Two or More Races Map | 210 | 11,853 | 9,009,073 |
| POPULATION, SEX | |||
| Male Map | 8,438 | 339,864 | 151,781,326 |
| Female Map | 7,883 | 332,727 | 156,964,212 |
| POPULATION, AGE (18 YEARS) | |||
| 18 years and over Map | 12,659 | 522,720 | 234,564,071 |
| Under 18 years | 3,662 | 149,871 | 74,181,467 |
| POPULATION, AGE | |||
| Under 5 years | 1,029 | 44,595 | 20,201,362 |
| 5 to 9 years | 949 | 40,076 | 20,348,657 |
| 10 to 14 years | 1,017 | 39,790 | 20,677,194 |
| 15 to 17 years | 667 | 25,410 | 12,954,254 |
| 18 and 19 years | 770 | 22,064 | 9,086,089 |
| 20 years | 483 | 12,484 | 4,519,129 |
| 21 years | 290 | 12,007 | 4,354,294 |
| 22 to 24 years | 607 | 34,465 | 12,712,576 |
| 25 to 29 years | 869 | 49,596 | 21,101,849 |
| 30 to 34 years | 800 | 40,889 | 19,962,099 |
| 35 to 39 years | 766 | 37,065 | 20,179,642 |
| 40 to 44 years | 935 | 38,197 | 20,890,964 |
| 45 to 49 years | 1,227 | 46,380 | 22,708,591 |
| 50 to 54 years | 1,402 | 50,277 | 22,298,125 |
| 55 to 59 years | 1,262 | 45,946 | 19,664,805 |
| 60 and 61 years | 365 | 15,575 | 7,113,727 |
| 62 to 64 years | 459 | 20,298 | 9,704,197 |
| 65 and 66 years | 287 | 11,302 | 5,319,902 |
| 67 to 69 years | 345 | 14,726 | 7,115,361 |
| 70 to 74 years | 491 | 20,845 | 9,278,166 |
| 75 to 79 years | 455 | 18,368 | 7,317,795 |
| 80 to 84 years | 409 | 15,548 | 5,743,327 |
| 85 years and over | 437 | 16,688 | 5,493,433 |
| MEDIAN AGE BY SEX | |||
| Both sexes Map | 39.40 | 37.00 | 37.20 |
| Male Map | 37.70 | 35.50 | 35.80 |
| Female Map | 41.00 | 38.70 | 38.50 |
| HOUSEHOLDS | |||
| Total Households Map | 6,651 | 281,192 | 116,716,292 |
| HOUSEHOLDS, HOUSEHOLD TYPE | |||
| Family households: Map | 4,171 | 170,916 | 77,538,296 |
| Husband-wife family Map | 3,432 | 136,522 | 56,510,377 |
| Other family: Map | 739 | 34,394 | 21,027,919 |
| Male householder, no wife present Map | 267 | 11,406 | 5,777,570 |
| Female householder, no husband present Map | 472 | 22,988 | 15,250,349 |
| Nonfamily households: Map | 2,480 | 110,276 | 39,177,996 |
| Householder living alone Map | 2,052 | 88,563 | 31,204,909 |
| Householder not living alone Map | 428 | 21,713 | 7,973,087 |
| HOUSEHOLDS, HISPANIC OR LATINO ORIGIN OF HOUSEHOLDER | |||
| Not Hispanic or Latino householder: Map | 6,590 | 277,505 | 103,254,926 |
| Hispanic or Latino householder: Map | 61 | 3,687 | 13,461,366 |
| HOUSEHOLDS, RACE OF HOUSEHOLDER | |||
| Householder who is White alone | 6,447 | 261,660 | 89,754,352 |
| Householder who is Black or African American alone | 24 | 2,557 | 14,129,983 |
| Householder who is American Indian and Alaska Native alone | 103 | 10,807 | 939,707 |
| Householder who is Asian alone | 24 | 2,253 | 4,632,164 |
| Householder who is Native Hawaiian and Other Pacific Islander alone | 0 | 97 | 143,932 |
| Householder who is Some Other Race alone | 17 | 1,116 | 4,916,427 |
| Householder who is Two or More Races | 36 | 2,702 | 2,199,727 |
| HOUSEHOLDS, HOUSEHOLD TYPE BY HOUSEHOLD SIZE | |||
| Family households: Map | 4,171 | 170,916 | 77,538,296 |
| 2-person household Map | 2,125 | 85,291 | 31,882,616 |
| 3-person household Map | 838 | 35,433 | 17,765,829 |
| 4-person household Map | 712 | 29,521 | 15,214,075 |
| 5-person household Map | 339 | 13,741 | 7,411,997 |
| 6-person household Map | 111 | 4,623 | 3,026,278 |
| 7-or-more-person household Map | 46 | 2,307 | 2,237,501 |
| Nonfamily households: Map | 2,480 | 110,276 | 39,177,996 |
| 1-person household Map | 2,052 | 88,563 | 31,204,909 |
| 2-person household Map | 381 | 17,240 | 6,360,012 |
| 3-person household Map | 27 | 3,080 | 992,156 |
| 4-person household Map | 12 | 1,037 | 411,171 |
| 5-person household Map | 4 | 241 | 126,634 |
| 6-person household Map | 2 | 77 | 48,421 |
| 7-or-more-person household Map | 2 | 38 | 34,693 |
| HOUSING UNITS | |||
| Total Housing Units Map | 7,503 | 317,498 | 131,704,730 |
| HOUSING UNITS, OCCUPANCY STATUS | |||
| Occupied Map | 6,651 | 281,192 | 116,716,292 |
| Vacant Map | 852 | 36,306 | 14,988,438 |
| HOUSING UNITS, OCCUPIED, TENURE | |||
| Owned with a mortgage or a loan Map | 2,686 | 105,017 | 52,979,430 |
| Owned free and clear Map | 2,080 | 78,926 | 23,006,644 |
| Renter occupied Map | 1,885 | 97,249 | 40,730,218 |
| HOUSING UNITS, VACANT, VACANCY STATUS | |||
| For rent Map | 298 | 7,422 | 4,137,567 |
| Rented, not occupied Map | 12 | 554 | 206,825 |
| For sale only Map | 90 | 2,734 | 1,896,796 |
| Sold, not occupied Map | 55 | 1,043 | 421,032 |
| For seasonal, recreational, or occasional use Map | 90 | 11,483 | 4,649,298 |
| For migrant workers Map | 2 | 319 | 24,161 |
| Other vacant Map | 305 | 12,751 | 3,652,759 |
| HOUSING UNITS, OCCUPIED, AVERAGE HOUSEHOLD SIZE BY TENURE | |||
| Total: Map | 2.31 | 2.30 | 2.58 |
| Owner occupied Map | 2.48 | 2.48 | 2.65 |
| Renter occupied Map | 1.87 | 1.96 | 2.44 |
| HOUSING UNITS, OCCUPIED, TENURE BY RACE OF HOUSEHOLDER | |||
| Owner occupied: Map | 4,766 | 183,943 | 75,986,074 |
| Householder who is White alone Map | 4,686 | 176,507 | 63,446,275 |
| Householder who is Black or African American alone Map | 4 | 443 | 6,261,464 |
| Householder who is American Indian and Alaska Native alone Map | 35 | 4,775 | 509,588 |
| Householder who is Asian alone Map | 17 | 752 | 2,688,861 |
| Householder who is Native Hawaiian and Other Pacific Islander alone Map | 0 | 35 | 61,911 |
| Householder who is Some Other Race alone Map | 7 | 338 | 1,975,817 |
| Householder who is Two or More Races Map | 17 | 1,093 | 1,042,158 |
| Renter occupied: Map | 1,885 | 97,249 | 40,730,218 |
| Householder who is White alone Map | 1,761 | 85,153 | 26,308,077 |
| Householder who is Black or African American alone Map | 20 | 2,114 | 7,868,519 |
| Householder who is American Indian and Alaska Native alone Map | 68 | 6,032 | 430,119 |
| Householder who is Asian alone Map | 7 | 1,501 | 1,943,303 |
| Householder who is Native Hawaiian and Other Pacific Islander alone Map | 0 | 62 | 82,021 |
| Householder who is Some Other Race alone Map | 10 | 778 | 2,940,610 |
| Householder who is Two or More Races Map | 19 | 1,609 | 1,157,569 |
| HOUSING UNITS, OCCUPIED, TENURE BY HISPANIC OR LATINO ORIGIN OF HOUSEHOLDER | |||
| Owner occupied: Map | 4,766 | 183,943 | 75,986,074 |
| Not Hispanic or Latino householder Map | 4,740 | 182,638 | 69,617,625 |
| Hispanic or Latino householder Map | 26 | 1,305 | 6,368,449 |
| Renter occupied: Map | 1,885 | 97,249 | 40,730,218 |
| Not Hispanic or Latino householder Map | 1,850 | 94,867 | 33,637,301 |
| Hispanic or Latino householder Map | 35 | 2,382 | 7,092,917 |
| HOUSING UNITS, OCCUPIED, TENURE BY HOUSEHOLD SIZE | |||
| Owner occupied: Map | 4,766 | 183,943 | 75,986,074 |
| 1-person household Map | 1,061 | 41,156 | 16,453,569 |
| 2-person household Map | 2,014 | 75,807 | 27,618,605 |
| 3-person household Map | 679 | 27,179 | 12,517,563 |
| 4-person household Map | 596 | 23,905 | 10,998,793 |
| 5-person household Map | 278 | 10,876 | 5,057,765 |
| 6-person household Map | 96 | 3,421 | 1,965,796 |
| 7-or-more-person household Map | 42 | 1,599 | 1,373,983 |
| Renter occupied: Map | 1,885 | 97,249 | 40,730,218 |
| 1-person household Map | 991 | 47,407 | 14,751,340 |
| 2-person household Map | 492 | 26,724 | 10,624,023 |
| 3-person household Map | 186 | 11,334 | 6,240,422 |
| 4-person household Map | 128 | 6,653 | 4,626,453 |
| 5-person household Map | 65 | 3,106 | 2,480,866 |
| 6-person household Map | 17 | 1,279 | 1,108,903 |
| 7-or-more-person household Map | 6 | 746 | 898,211 |
Loading...